August 2026: Interaction, Stability, and Release 1.0.0
This post covers the final month of development for the classbound package. August focused on complex user interactions and system stability. I transformed the Shiny application into a stable tool. I finished the testing suite. I published the 1.0.0 release.
Precision Drawing and Outliers
I rebuilt the canvas interaction tools. Drawing data points on the browser plot was inconsistent. The native Shiny brush drops mouse events. This creates sparse dots when you move your cursor fast.
I built a continuous coordinate system. The R backend calculates the geometric line between browser events. It fills in the missing coordinates. I removed the default rectangular brush. I added a custom SVG ink trail. Users draw smooth shapes at any mouse speed. I tied the brushing radius to screen space instead of data space. The drawing tool feels consistent at any zoom level.
Data contamination testing required an upgrade. I replaced the random scatter generator with a strict mathematical model. The new system injects outliers using Mahalanobis distance and Tukey fences. This ensures the synthetic outliers match the statistical distribution of the original classes. Users paint these outlier clusters onto their training data. They can test their models against noisy data.
High-Dimensional Detection
The core purpose of classbound is rendering decision boundaries. In two dimensions, you evaluate a grid. In high dimensions, calculating a dense grid consumes too much memory.
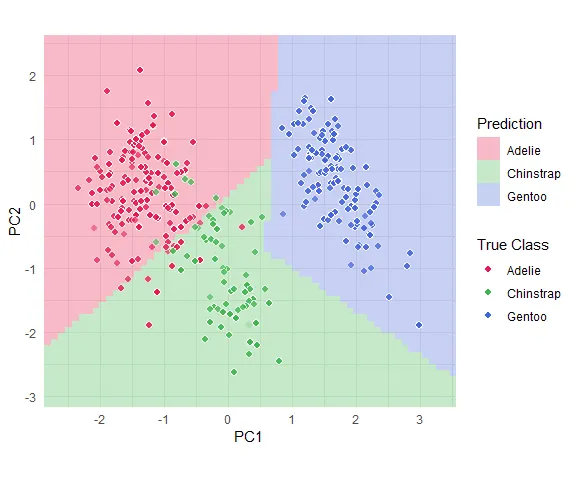
I built a new detection algorithm called boundary_explore_nd. The function samples the multi-dimensional volume. It asks the model for predictions. It isolates the exact points that sit on the boundary border.
This enables high-dimensional analysis. Users pipe these detected boundary points into projection matrices like PCA. They can also use projection pursuit algorithms from the tourr package. This reveals the shape of the model logic.
Export Synchronization
The application needed to work within real machine learning workflows. Users needed a way to extract their interactive configurations into R code.
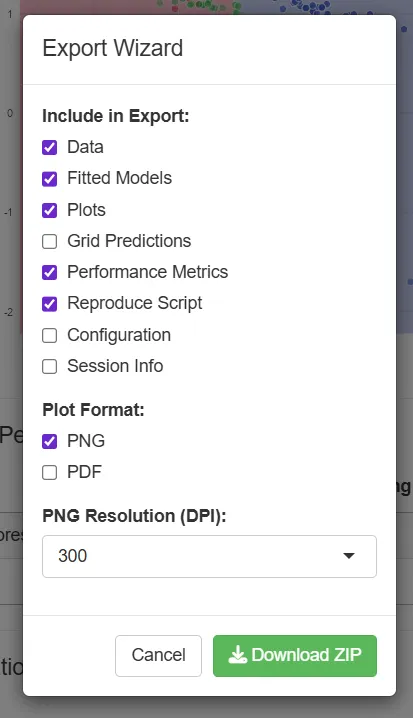
I built an export architecture. The application features a dedicated Export Wizard. Users download their simulated dataset, their rendered plots, and the fitted model objects. I built a background synchronization engine. The system takes a snapshot of every user interface input. It saves this snapshot into a JSON configuration file. This guarantees that the exported state matches the screen state. It prevents race conditions.
Stability and User Interface
The underlying system required robust foundations before release.
I migrated the ensemble adapter from PPforest to the ppforest2 package. The original implementation suffered from subsetting bugs. These bugs caused application crashes during single-row predictions.
I solved user interface delays. Rendering a hundred different class colors used to freeze the browser. I implemented a Document Object Model preservation technique. The application handles large class counts without delay. I wrote a custom natural sort function. The application orders string classes logically instead of alphabetically.
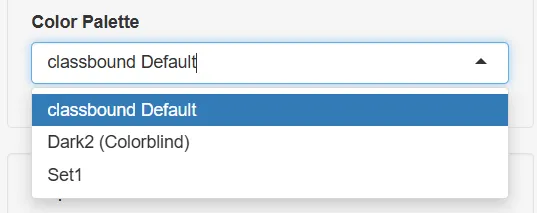
The application now supports multiple color palettes. Users select between the classbound default, a colorblind-friendly Dark2 scheme, and the standard Set1 scheme. This improves accessibility and visual clarity.
I enforced a strict one-to-one aspect ratio lock on the plotting canvas. If the physical plot scales with the numerical data range, the boundary shape becomes distorted. Forcing a true square plot ensures the geometry of the boundary is accurate.
Package Maturity and Release
The package is mature. I implemented native base R generic dispatch. Users pass a boundary object into the standard plot() command. They do not need to call custom plotting functions.
I built a testing suite to guarantee stability. The suite validates row counts, column types, random seeds, and Shiny interface states. All 247 assertions pass. The package clears the R command checks with zero errors, zero warnings, and zero notes.
I finished the documentation. I wrote six vignettes. Topics range from tidymodels integration to custom adapter creation. I compiled a pkgdown website. I embedded a searchable help panel into the interactive application.
This release marks the culmination of my Google Summer of Code project. The classbound package stands ready for real-world analysis. Version 1.0.0 is available now.